System Design Report Format
TroubleshootingHow to interpret the evaluation results of system design format tests
In system design format tests, the code (system diagram) submitted by candidates is evaluated automatically and quantitatively. This article explains the definition of each metric displayed on the evaluation screen and how to check the results in detail.
Definition and calculation methods of key metrics
The evaluation items are broadly divided into four categories: "Score," "Availability," "Scalability," and "Consistency."
Important Depending on the content of the problem, some evaluation items (categories) may not be present.
The definitions of each metric are as follows:
- Score
- A comprehensive score calculated by the accuracy rate for all evaluation items, including both "Availability" and "Scalability."
- Availability
- An indicator to determine whether the design minimizes system downtime.
- Calculated by the accuracy rate of items classified under the Availability category.
- Scalability
- An indicator to determine whether the design can flexibly expand system performance in response to increased load.
- Calculated by the accuracy rate of items classified under the Scalability category.
- Consistency
- An indicator to determine whether the design ensures that the latest written data is retrieved for all data reads.
- Calculated by the accuracy rate of items classified under the Consistency category.
Answer details and process data
Data regarding the candidate's answer process can be checked in the following items (as of 2026/01/07):
- Time elapsed: Time taken to complete the submission
- Hints used: Total number of hints used until submission
- Executions: Number of times test cases were executed
Evaluation item judgment logic
You can check the details by expanding the accordion menu for evaluation items.
- Judgment Mechanism
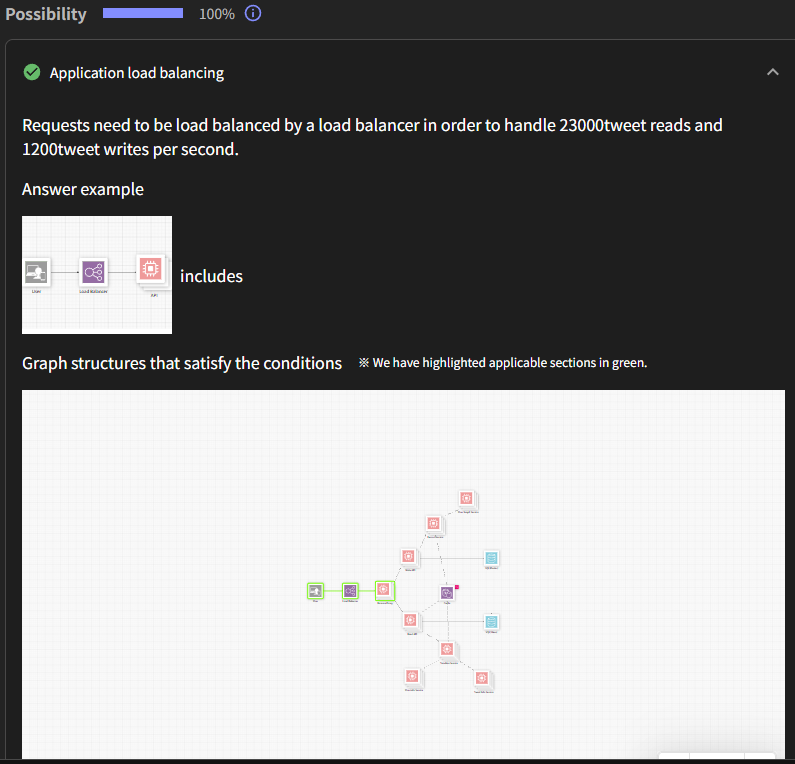
- Each evaluation item has a correct "graph structure" set.
- If that graph structure exists in the system diagram submitted by the candidate, it is determined as a "perfect match of graph structure" by AI.
- Highlight Display
- If correct, the part of the submitted system diagram that matches the condition will be highlighted in green.
Manual editing of judgment results
The results of automatic judgment are predictive. You can manually change the judgment if necessary.
Important Changing judgments requires manager or higher privileges.
- Editing is possible via the "Edit scoring results" button.
- Edited content will be automatically recalculated and reflected in the score.
Submission content confirmation tools
These are functions to check the system diagram created by the candidate and their thought process.
Submitted Answer (System Diagram)
This displays the system diagram ultimately submitted by the candidate. This output forms the basis for score calculation.
Playback Function
This function allows you to play back the design process as a video. By clicking the "Playback" tab and then the play button, you can see the order in which the design was carried out.
Available Plans This feature is available with the Standard Plan or higher.
Description
This is the natural language (free text) input by the candidate during the exam. It describes their approach to the problem and the thought process that led to their deliverable.